Ahh it’s that time of your project. You have worked together your first prototype, a few reflection probes here and there, some scripts for your character and a menu to go with your level flow. You hit play and your glorious masterpiece runs at a staggering 10 frames per second. Some of us go into a stage of denial and search for bugs in the render pipeline, others open the nearest StackOverflow tab and start to ask the same questions over and over: How to speed it up? Well it all depends on your project, but there are some key points that you can look into. I will start with some theory and get into the juicy coding later on.
The basics
Plan ahead
You may have heard this a thousand times already, but every good project stands and falls with a little research upfront. If your code ends up as spaghetti, then so will your performance. And I’m not even talking about the debuging issues. Trust me, I write spaghetti code for a living. You don’t need to write the entire game on paper, before touching code, but keep in mind that you want to have a clean code base at the end.
Know your enviroment
I saw a lot of developers complaining about poor performance, while running the app in editor mode, with deep profiling on. An important thing is to know where to even test your performance. You can use profiling to find the sections of your code that consume the most resources. But keep in mind that editor mode and any profiling will create overhead. In other words: Profiling makes your game slower. To see the real performance, strip your game from all logs and profiling settings, build it completely and run it on the device of your choice. This alone makes a huge difference.
Pro-filing
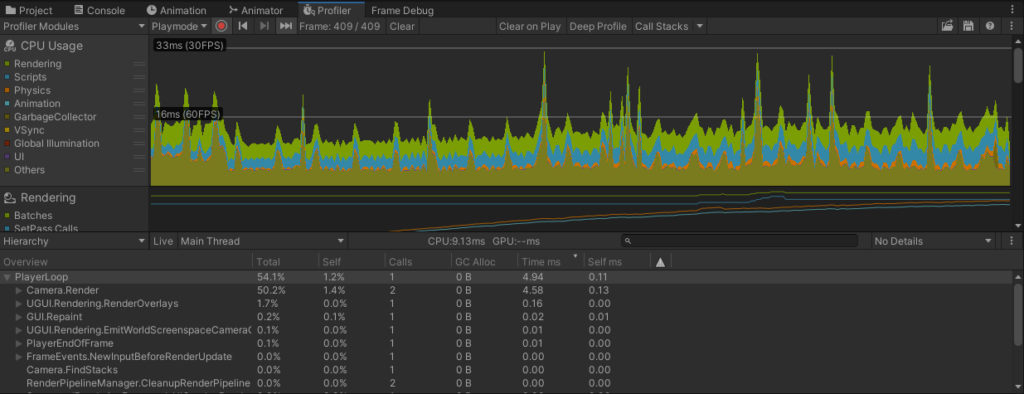
While my heading may be boring, Unity’s built in Profiler will certainly satisfy your unsatisfiable hardware hunger. You can use it to find the sections/methods of your code that use the most resources. With “Deep Profiling” enabled even down to individual array accesses. Even if you have 200 fps: Give it a look. It gives you a good feeling of what operations take longer than others and what to avoid. You can open the Profiler from the Unity menu: Window -> Analysis -> Profiler.
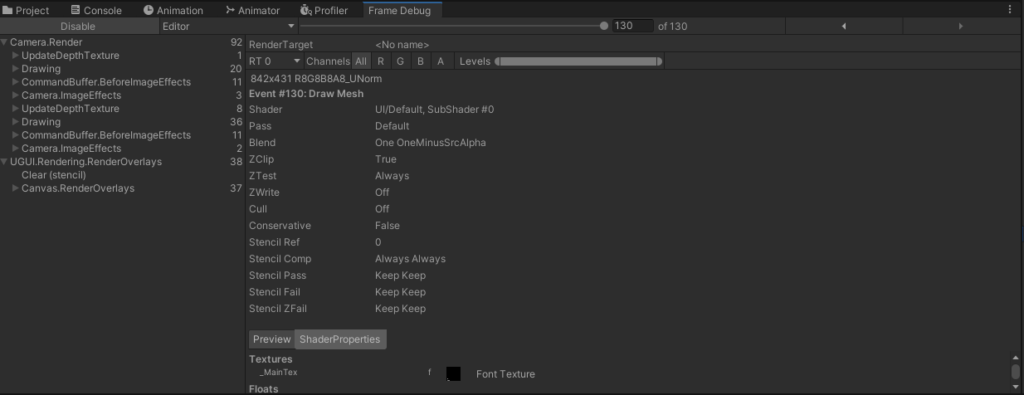
There is also a thing called the “Frame Debugger”, which is essentially a GPU profiler. It gives you the ability to see what is rendered to your screen and how much draw calls are made. Lower draw calls = more fps. You can open the Frame Debugger from the Unity menu: Window -> Analysis -> Profiler.
Only milliseconds from doom
Usually you want to run your game at around 60 frames per second. Using simple calculus (1s/60fps), we can calculate how much time we have for each frame: 0.016s or 16ms. And that for everything that has to be done in a single frame: Updating all game objects, passing data from and to the GPU/CPU/RAM, rendering all objects into the view, rendering them again for shadows, and so on. As you can already see 16ms is not really that much and depending on your hardware a single operation can take more or less time. So you want to use the absolute minimum time possible per frame. But more on that later.
The techniques
Keep it (un)real
No not the engine, we are doing Unity stuff here. I’m talking about our desire as humans to apply real world logic to everything we do. Games are not simulations. Now I can already hear some of you scream, but let me explain: As of 2021, we can generate literally anything with a computer. The problem is that most of the fancy stuff just takes too long to be done at glorious 60 or even 120 frames per second. Even 30 fps is way too fast for complex simulations.
So we abstract. We decieve. It’s all about the end result, not the mess behind the curtains. You may have heard of the “train hat” easter egg in Fallout 3, a famous (and pretty damn funny) example of how it’s not always how it looks like.
In terms of performance this would mean to not be lazy and just create a single script for your whole game (looking at you YandereDev), or just calling it “Enemy” and putting the whole AI system in there…on each game object. This goes very thight with planing up front. Use established programming patterns. Use services. Use controllers. Use patterns. There are there for a reason.
Clustering and Abstraction
Big games tend to have a lot of updates for things that aren’t even on the screen. This is sometimes necessary for games like Factorio, where you want your factory to run even when you are not around in a specific area. In “some” cases it can also be the result of “lazy” programming. Like that Fallout 3 thing I mentioned before.
For example: Let’s pretend that we are writing a strategy game. Lots of units everywhere, Total War style. It’s very easy to just write an “Update()” method for your units and move them around. But with increasing numbers of units, you will notice an ever increasing drop in fps.
With some simple design choices we can drastically enhance that though. Instead of letting each unit compute it’s own movement in a dedicated Update method. We will register all of them in a service and calculate movements from there. In most cases we want a register of our units anyway.
The reason why this is faster is because every intermediate call costs us time. Remember that. And that is especially true for Unitys magic methods like “Update”. If you have a script that is instanced ALOT: don’t use Update. Bunch up your instances into a service and loop over them. Or even better: Create clusters of many things in the same place or with the same agenda. Consider a group of units in formation for example: If they all move in the same direction, why calculate it for every single one of them? We can just do it once and apply it to every unit in that group…or…cluster.
These concepts deserve a tutorial on their own, so excuse me if this seems a little short. I will go into more detail with general gaming concepts in later tutorials. It also really comes down to your ability to abstract a problem (e.g. your game) into an efficient system. Because, if you like it or not, your game not only needs a good core idea, but also a good code base.
Child support is expensive
Every game object, child, script, instance, sound, unit, animation, method call,… will impact your performance. So keep the amount of everything as low as possible. There is not really much to say about this topic, but it’s a very important one nonetheless. In search for your performance leaks it often comes down to finding a way to reduce the amount of calls or objects. Because the amount of calls to the CPU literally equals your games performance. And everything you do calls instructions on the CPU.
Calculate once, safe for later
Alot of performance optimization comes from correctly balancing your resources (CPU, RAM, Hard Storage). Keep in mind that each of them is dedicated for a specific use case. For example you only have so much CPU power to handle all of your game calculations. If there is something that is calculated every frame, but doesn’t actually change every frame, why not cache that in your RAM? The basic convention here is: If you are going to use some specific value more than once a frame: Save it in a something like a class variable and call that variable, instead of doing the calculation again.
A method called, that doesn’t actually change any value of your game, is a wasted call. So developers usually cache the result of that calculation for repeated use. And in extension why should we recalculate something that doesn’t change between game sessions? Like your save data for example. Let’s pretend you have developed a RPG. Now you don’t want your game world to be regenerated everytime you load the game. No. You want to save it upon closing the game and load it again when starting the game. Take these concepts and use them for other things of your game.
You may have also heard the term “baking”. Like you would do for navmesh data or baked global illumination. This just refers to calculating the data once in your Editor view and instead of doing it again every frame you are just saving the data on your storage (hard drive). It will then be loaded into your RAM when the respective scene is loaded. Unity handles all of that for you, so you probably didn’t notice what is actually happening. But that’s the whole magic. Calculate once, safe for later.
Platforms, Graphic Tiers and QUALITY
And lastly, before we get to the juicy stuff, remember that not all devices are created equal. Mobile phones work different than PCs. Not only in terms of controls, but also in terms of what you can and should do. Most mobile phones are (as of now) not at the same level as desktop PCs. You can’t for example use a compute shader on every mobile phone. Consoles are restricted to the specs fo there respective generation. And WebGL has an overhead, because it shares resources with your browser. These are jsut examples, but I think you get what I mean.
Besides the quirks of your target platform, you should also take a look into Unity’s builtin graphic tier system. Under “Edit->Project Settings->Graphics” you can find the following view. This is where you can define the base settings for your tiers.
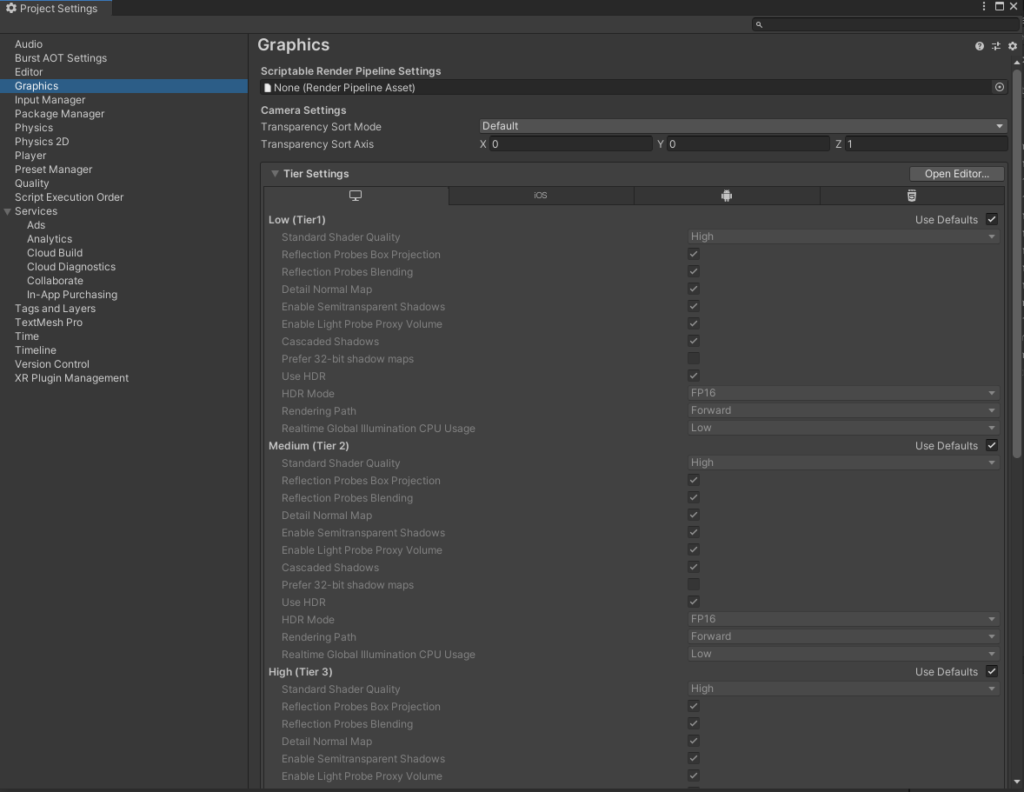
The graphics tier is preselected by the device your game is running on. You can find out more about how this is selected in the official documentation.
Now the graphics tier is the base of your quality configuration, but the real stuff happens in the same window under the nav point “Quality”. Have a look:
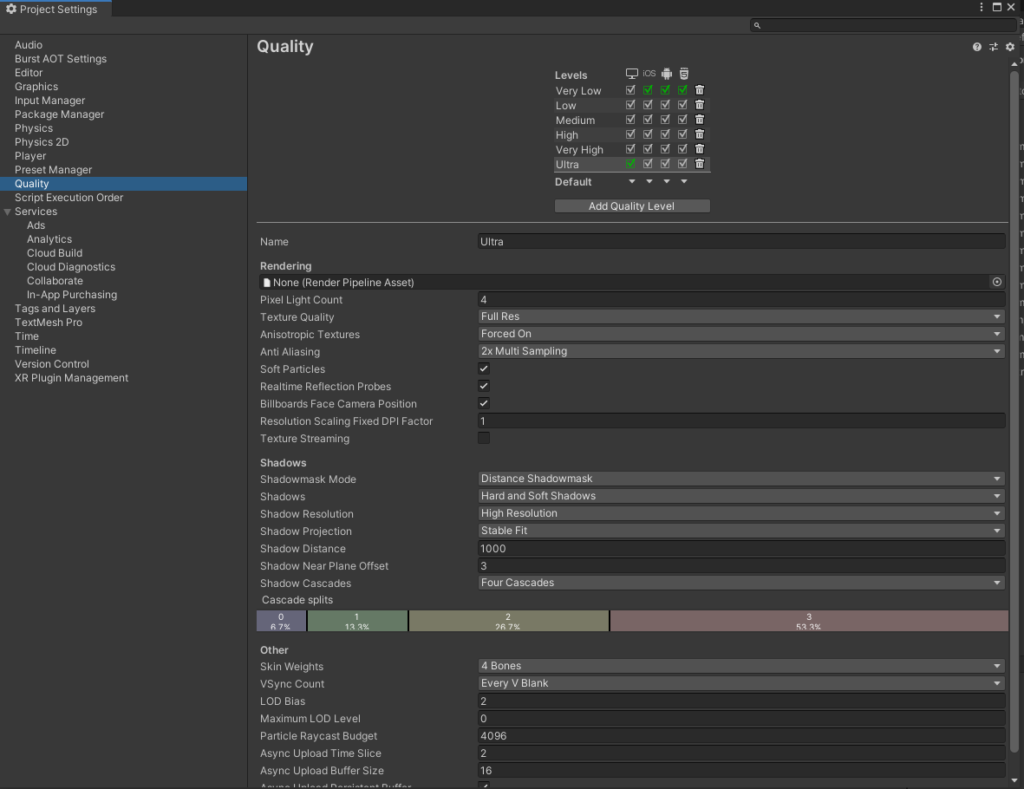
As you can see, you can even add your own quality levels and rename them as you like. They are also able to be dis-/enabled per plattform. Using this you can immediatly give your players the ability to raise/lower the graphical details of your game, without changing anything in your game. Well besides a graphics menu maybe. Anyway, before attempting to modify these values, please read up on what they actually do and if changing them will benefit your specific case.
To implement Quality settings into your game you can use the following lines to change or read the current Quality level. Note: Quality levels are identified by their index in the list above, not the actual name.
//get current quality level
int qualityLevel = QualitySettings.GetQualityLevel();

//get all quality levels
string[] names = QualitySettings.names;

//set quality level

QualitySettings.SetQualityLevel(levelIndex, true);
This can be useful if you have different effects for different quality levels. You could for example create a low resolution explosion effect that is instantiated on the lowest quality level and use a better one on higher levels, just like this:
//Instantiate(defaultExplosion);

if (QualitySettings.GetQualityLevel() == 0)
    Instantiate(lowResExplosion);
else
    Instantiate(highResExplosion);
The juicy stuff
Congratiulations, you made it through the theoretical part. Now let’s get to the juicy stuff. There are many patterns, modules and functionalites that you can use to boost your performance. I will introduce you to some of them, the important ones in my opinion.
Render Path
You may have noticed that you can set a “Render Path” in your Graphics Tiers from the last section. Since this topic is already covered in like a thousand articles and by Unity itself, here is the link to an official tutorial. But to summarize the basics: It basically comes down to how many lights are affecting how many objects. Yes you read that right. Lights. Lighting calculation is a very compute heavy task. So choosing the right Render Path is very important.
The “Forward” Render Path renders objects based on every light that is actually affecting them. So your render cost increases for each additional light illuminating a single object.
The “Deferred” Render Path on the other hand computes the light on a per-pixel basis and has huge advantage when you have multiple lights illuminating the same object. However it requires better hardware, since the “base cost” of rendering is higher. There is also the problem that it is not available on all mobile devices as of now.
Instancing/Pooling
Everytime you create a new instance of a prefab (usually using the “GameObject.Instantiate” method), it is rebuild entirely from scratch, loaded into your memory and your GPU, and then activated in your scene. The main overhead here comes from creating the new instance. Activating or deactivation on the other hand is very fast.
This is an example of the right management of resources (CPU, RAM, etc.), which we have already talked about. When starting with Unity you will usually just use the Instantiate method to create the object you need from a Prefab and later destroy it with the appropriatly named Destroy method. This is totally okay. BUT if you are doing that with for example your bullets, you will notice a drop in FPS everytime you fire your gun. That is because of the aforementioned overhead of creating the object from scratch. We can counter that by instantiating like 100 bullets upon loading the game, deactivating them all and activating them as they become necessary. After they have done their job (e.g. hitting something), we are not destroying them completely, but deactivating them. Depending on how complex the object is you can save precious milliseconds.
Pooling is also not that complicated. I have an implementation that I use myself for various projects. You can find it on GitHub and use it for your own research if you want. It automatically creates new instances and makes setting up an object pool alot easier.
Job System
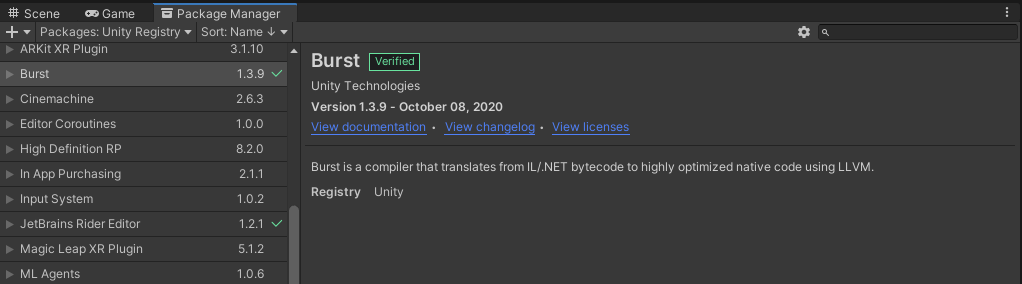
The Job System and in extension the Burst Compiler provided with the introduction of the ECS is basically free performance. The ECS, short for Entity Component System, is a little too much for this tutorial, so we will talk about that another time. The Job and Burst functionality can be activated by downloading the “Burst” package from the Package Manager.
First we again need some theory (sorry): Multithreading. If your never did anything with Jobs, Threads or Tasks, chances are your game is not using the full potential of your CPU. This comes inherently from the fact, that Unity simply can’t automatically distribute your game’s logic over all of the CPU cores that you have available. There are strong technical reasons behind this like the aforementioned race conditions. That’s why your game in it’s default state is “single threaded”. All of what your game needs to do runs on a single core (or thread for that matter). The other cores are simply left untouched.
Using the Job System you can easily setup a calculation to be executed on another thread, effectively running parallel to your main logic, instead of sequential. There, free performance. It sounds simple, but as I said Unity can’t do it automatically, because it is strongly coupled to what you actually want to do. For example, using a Job to compute the next position of your character is possible, but you will notice that your character stutters. Why? Because when the computation of that Job is run, it is possible that it takes longer than the time you need to finish the actual frame. So the frame is rendered with the old position data and only after the thread is finished the value will be accessible and can be applied.
Jobs are simple to setup, you just need to create a class implementing the IJob interface. Like in the example on the Unity website.
using UnityEngine;
using Unity.Collections;
using Unity.Jobs;

class ApplyVelocitySample : MonoBehaviour
{
    struct VelocityJob : IJob
    {
        // Jobs declare all data that will be accessed in the job
        // By declaring it as read only, multiple jobs are allowed to access the data in parallel
        [ReadOnly]
        public NativeArray<Vector3> velocity;

        // By default containers are assumed to be read & write
        public NativeArray<Vector3> position;

        // Delta time must be copied to the job since jobs generally don't have concept of a frame.
        // The main thread waits for the job on the same frame or the next frame, but the job should
        // perform work in a deterministic and independent way when running on worker threads.
        public float deltaTime;

        // The code actually running on the job
        public void Execute()
        {
            // Move the positions based on delta time and velocity
            for (var i = 0; i < position.Length; i++)
                position[i] = position[i] + velocity[i] * deltaTime;
        }
    }

    public void Update()
    {
        var position = new NativeArray<Vector3>(500, Allocator.Persistent);

        var velocity = new NativeArray<Vector3>(500, Allocator.Persistent);
        for (var i = 0; i < velocity.Length; i++)
            velocity[i] = new Vector3(0, 10, 0);


        // Initialize the job data
        var job = new VelocityJob()
        {
            deltaTime = Time.deltaTime,
            position = position,
            velocity = velocity
        };

        // Schedule the job, returns the JobHandle which can be waited upon later on
        JobHandle jobHandle = job.Schedule();

        // Ensure the job has completed
        // It is not recommended to Complete a job immediately,
        // since that gives you no actual parallelism.
        // You optimally want to schedule a job early in a frame and then wait for it later in the frame.
        jobHandle.Complete();

        Debug.Log(job.position[0]);

        // Native arrays must be disposed manually
        position.Dispose();
        velocity.Dispose();
    }
}
In the case of this example, the code calls “jobHandle.Complete();”, which as described by the comments will actually nullify the benefit of running it in the first place. That’s because if you call it, you will actually block the main thread until the job thread is finished. Which you obviously don’t want to do.
Burst Compiler
Now we come to the extension of the Job functionality: the Burst Compiler. You may have noticed that the Job doesn’t contain a single class, array, string or other “managed type”. This is because you can add a simple compiler tag to the struct to convert all of the code into native code. You could use a managed type, but that would cause the Burst compiliation to fail and the Job to run as if it was regular managed code. To activate the Burst Compiler for a Job, just add the “BurstCompile” tag like this:
[BurstCompile(CompileSynchronously = true)]
struct VelocityJob : IJob
{
    ...
}
As said, this converts the code into native code. The downside is that you can only use scalar types like int, float, double, etc. and the dedicated struct NativeArray. This NativeArray is exactly what it sounds like, it’s the native representation of an array, instead of the managed one that you are used to. In managed code, the language itself keeps track of your arrays and other references and diposes them as needed. This creates an overhead, which is subject of the Burst Compiler. It can just get rid of the managed part of that code snippet and execute it as if you have written it in something like C++. This results in a massive performance boost. I’m not kidding, it can go as far as to half the time needed for the whole operation.
However keep in mind that setting up a job itself and passing data from/to a Job has overhead. So you want to design your Jobs in a way that you give it minimal data, compute alot and give back minimal data. Also you can further speed up the Job by setting the “ReadOnly” and “WriteOnly” tags for the attributes. Which obviously results in loosing the ability to read or write to a variable, but in favor of another performance increase.
Compute Shader
Compute Shaders are somewhat similar to the Jobs that we just talked about. Only that we use the GPU, instead of the CPU to compute whatever we want to do. However here is a stark difference in setup and use cases.
First off, a Compute Shader uses the power of parallel floating point operations that GPUs are dedicated to do very fast. I won’t go to deep into why that is, just not that GPUs are by design monsters when it comes to do floating point operations. But they are exceptionally bad at handling conditions. That’s where a CPU shines. For example, you can write and use the if statement in a shader. But in the background the shader will execute every line of code and only later discard everything from the condition block that was not met.
Compute Shaders are most effective when used for smaller operations that are executed the exact same way thousands of times. Like updating the movement of thousands of projectiles simultaniously.
Here is a slight modified example form the Unity docs:
// test.compute

#pragma kernel FillWithRed

RWTexture2D<float4> res;

[numthreads(8,8,1)]
void FillWithRed (uint3 dtid : SV_DispatchThreadID)
{
    res[dtid.xy] = float4(1,0,0,1);
}
To use a compute shader, you will have to do something similar to what we have done to setup a Job:
public ComputeShader shader;

private void RunComputeShader()
{
    int kernel = shader.FindKernel("FillWithRed");

    RenderTexture tex = new RenderTexture(256,256,24);
    tex.enableRandomWrite = true;
    tex.Create();

    shader.SetTexture(kernel, "Result", tex);
    shader.Dispatch(kernel, 256/8, 256/8, 1);
}
You may have noticed, the corelation between “[numthreads(8,8,1)]” and “shader.Dispatch(kernel, 256/8, 256/8, 1);”. What that actually does is you start the ComputeShader by giving it a Texture with the size of 256 by 256 pixels. The GPU itself when processing this texture (filling it with red here), will create so called “thread groups”. Each thread group can contain up to 64 threads running in parallel, depending on your hardware. Usually it’s 32 or 64 threads. The GPU can only handle on thread group at each time. With “numthreads(8,8,1)” we have told the CPU that one of those thread groups contains 8 threads for the x axis, 8 for the y axis, and 1 for the z axis (8 * 8 * 1 = 64 threads per group). The current 3D thread ID is passed within the “dtid” variable and are is to identify which index of our input buffer is currently being worked on by the thread. In this case: Our current pixel coordinates.
“shader.Dispatch(kernel, 256/8, 256/8, 1);” on the other hand tells the Compute shader to spawn 256/8 = 32 thread groups on both the x and y axis and 1 for the z axis. If you change a value in “numthreads”, you would also change the respective division in “Dispatch”. For example like this:
//Compute Shader
[numthreads(16,4,1)]

//Script
shader.Dispatch(kernel, 256/16, 256/4, 1);
Since you probably want to do more than just fill a texture or maybe you just need another data type, you can use every variable type that you would normally use in a shader. Just use “SetFloat” instead of “SetTexture”. However you will obviously need to change the Dispatch so it creates as many threads as possible.
For more complex data, that is not a 2D array of colors like a texture, you can use so called Structured Buffers. Implementing them is simple. See for yourself:
//Compute Shader
#pragma kernel FillWithZero

RWStructuredBuffer<int> readWriteIntBuffer;

[numthreads(1,1,1)]
void FillWithZero (uint3 dtid : SV_DispatchThreadID)
{
    readWriteIntBuffer[dtid.x] = 0;
}
//Script
int dataSize = 10;
int[] data = new int[dataSize];
ComputeBuffer buffer = new ComputeBuffer(dataSize , sizeof(int));
buffer.SetData(data);
int kernel = shader.FindKernel("FillWithZero");
shader.SetBuffer(kernel, "readWriteIntBuffer", buffer);
shader.Dispatch(kernel, data.Length, 1,1);You can use a variety of buffers depending on your actual use case. Here are some examples. Similar to the ReadOnly and WriteOnly tags from the JobSystem you have either a StructuredBuffer (read only) or a RWStructuredBuffer (read & write).
StructuctedBuffer<float> floatBuffer;
RWStructuctedBuffer<float> readWriteFloatBuffer;
struct SampleStruct
{
    float3 value1;
    int value2;
};
RWStructuredBuffer<SampleStruct> readWriteStructBuffer;
Now you can enjoy the immense power of your GPU for batching floating point operations. Again keep in mind that sending data from and to the GPU creates overhead as with Jobs. So keep it as minimal as possible.
Outro
There are many more methods to increase performance in specific areas, like a texture atlas, shared render textures, lod meshes, and so on. But this tutorial is already long enough, so these things have to wait for another time.
Anyway, that’s all. I hope you could increase your FPS by like 100%. Chances are you could actually. If you never heard of anything from this tutorial before (which ideally is not the case), you will find that you can get ALOT of performance back from possible technical debts.
Stay frosty folks.